BOBCAT Network
Reports By County Level
Adams County
The economy of Adams County employs 10,100 people. Its largest industries are manufacturing (1,774 people), retail trade (1,618 people), and health care and social assistance (1,599 people), and the highest paying industries are utilities ($69,063), and finance and insurance ($56,938). A 2019 report identified Adams County as the poorest in Ohio with a 23.8% poverty rate and median household income of $36,320 ($16,000 less than the state average). The county also has the state’s highest unemployment rate at 6.8%. Poor economic conditions led to a 2.1% decrease in the county’s population during the previous five years
Reports
Brown County
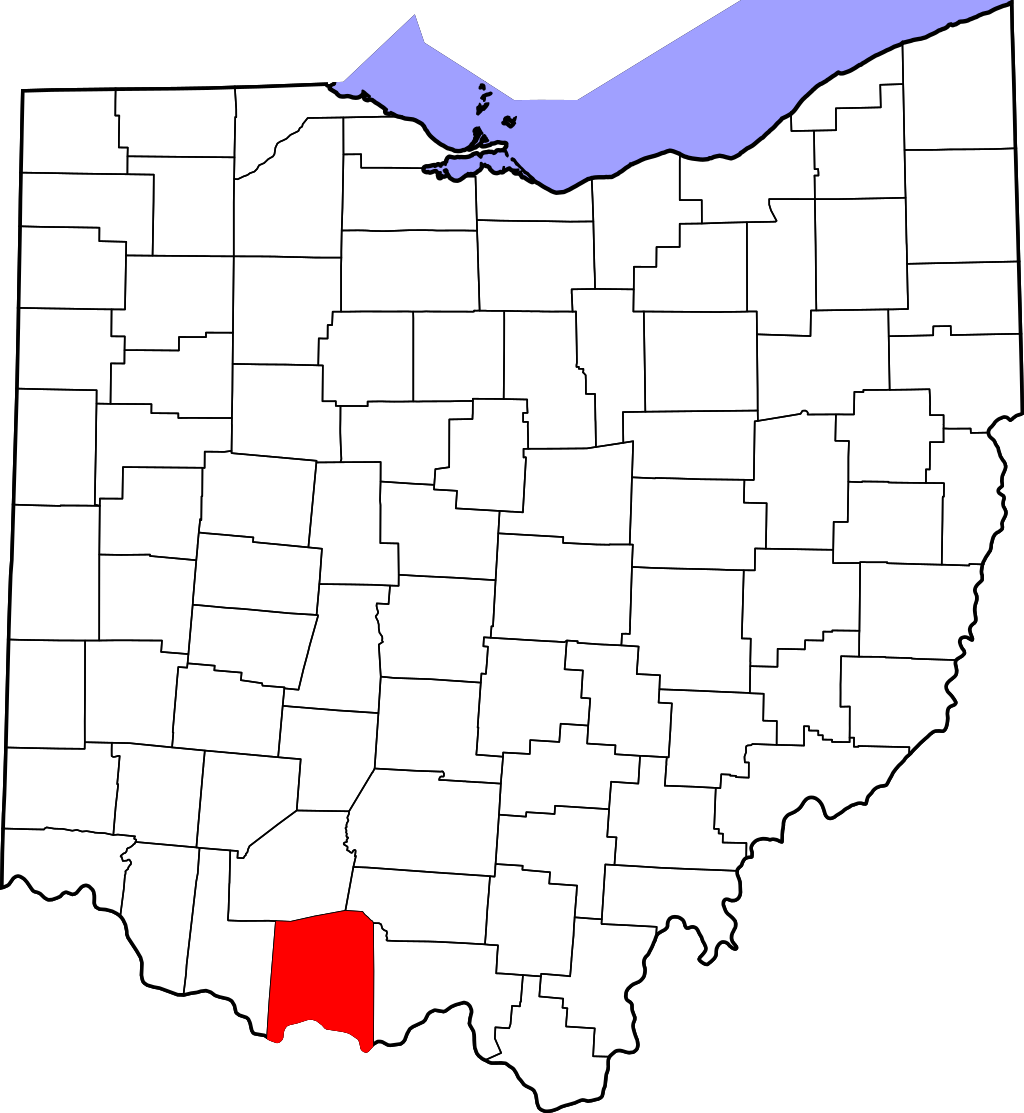
As of the 2010 United States Census, there were 44,846 people, 17,014 households, and 12,379 families in the county. The population density was 91.5/sqmi (35.3/km2). There were 19,301 housing units at an average density of 39.4/sqmi (15.2/km2). The racial makeup of the county was 97.5% white, 0.9% black or African American, 0.2% Asian, 0.2% American Indian, 0.2% from other races, and 1.0% from two or more races. Those of Hispanic or Latino origin made up 0.6% of the population. In terms of ancestry, 27.0% were German, 14.2% were Irish, 12.5% were American, and 9.7% were English.
The median income for a household in the county was $45,887 and the median income for a family was $54,184. Males had a median income of $39,049 versus $30,890 for females. The per capita income for the county was $20,167. About 9.0% of families and 12.4% of the population were below the poverty line, including 18.2% of those under age 18 and 8.4% of those age 65 or over.
Reports
Clermont County
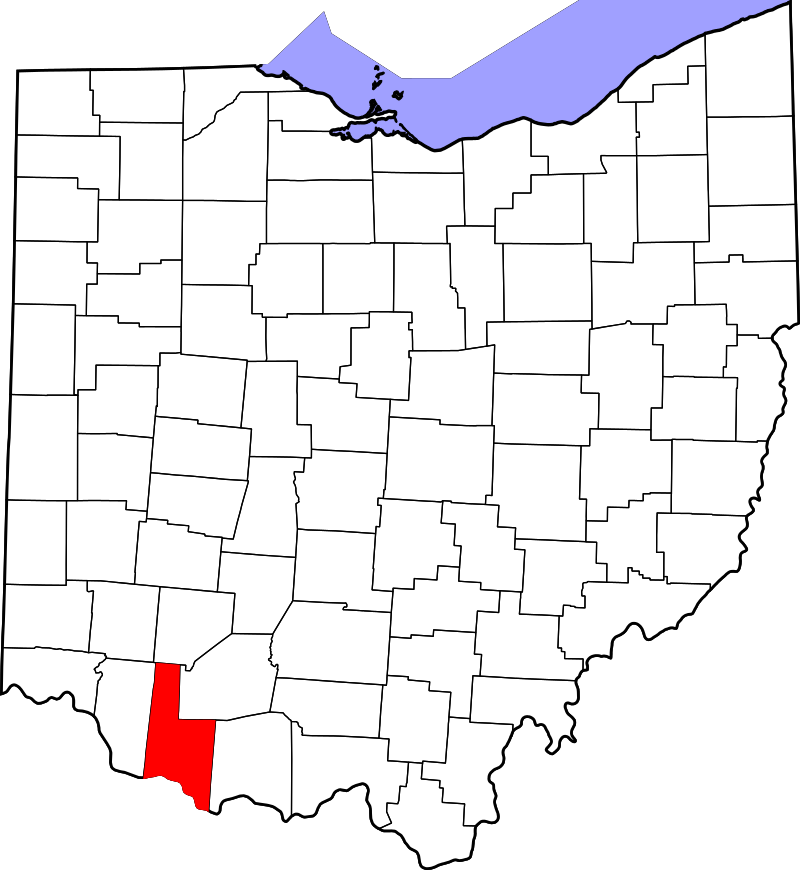
As of the 2010 United States Census, there were 197,363 people, 74,828 households, and 53,800 families residing in the county. The population density was 436.5 inhabitants per square mile (168.5/km2). There were 80,656 housing units at an average density of 178.4 per square mile (68.9/km2). The racial makeup of the county was 95.9% white, 1.2% black or African American, 1.0% Asian, 0.2% American Indian, 0.4% from other races, and 1.3% from two or more races. Those of Hispanic or Latino origin made up 1.5% of the population. In terms of ancestry, 34.0% were German, 18.1% were Irish, 12.0% were American, and 11.1% were English.
The median income for a household in the county was $58,472 and the median income for a family was $68,485. Males had a median income of $50,204 versus $36,746 for females. The per capita income for the county was $27,900. About 6.9% of families and 9.3% of the population were below the poverty line, including 12.6% of those under age 18 and 5.5% of those age 65 or over.
Reports
Fayette County
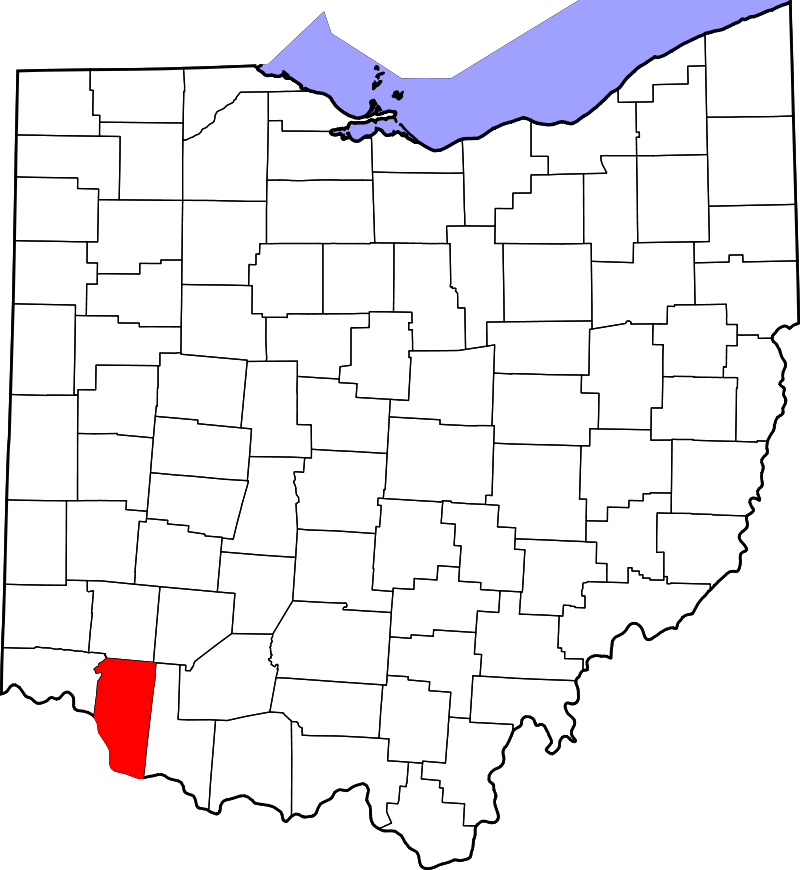
As of the census of 2010, there were 29,030 people, 11,436 households, and 7,834 families living in the county. The population density was 71.4 people per square mile (27.6/km2). There were 12,693 housing units at an average density of 31.2 per square mile (12.1/km2). The racial makeup of the county was 94.63% White, 2.02% Black or African American, 0.23% Native American, 0.54% Asian, 0.03% Pacific Islander, 0.80% from other races, and 1.74% from two or more races. 1.79% of the population were Hispanic or Latino of any race.
As of 2013, the median income for a household in the county was $37,619, and the median income for a family was $45,108. Males had a median income of $30,516 versus $20,223 for females. The per capita income for the county was $20,603. About 16.1% of families and 20.1% of the population were below the poverty line, including 27.4% of those under age 18 and 9.1% of those age 65 or over.
Reports
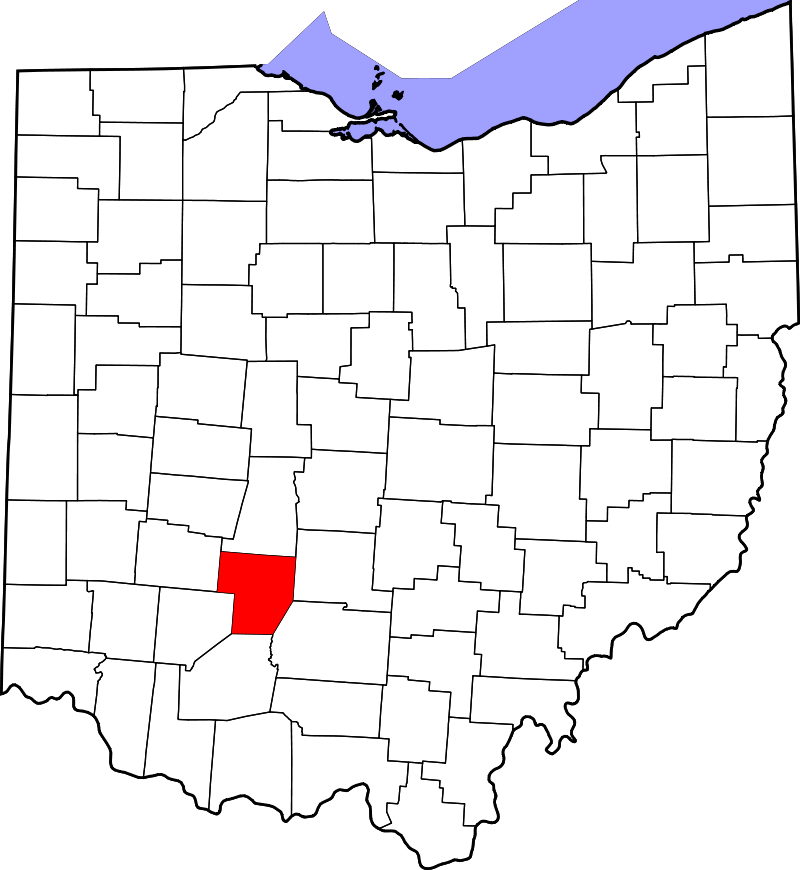
Gallia County
As of the 2010 United States Census, there were 30,934 people, 12,062 households, and 8,264 families living in the county. The population density was 66.3 inhabitants per square mile (25.6/km2). There were 13,925 housing units at an average density of 29.8 per square mile (11.5/km2). The racial makeup of the county was 94.7% white, 2.6% black or African American, 0.5% Asian, 0.4% American Indian, 0.2% from other races, and 1.6% from two or more races. Those of Hispanic or Latino origin made up 0.9% of the population. In terms of ancestry, 18.6% were American, 15.9% were German, 15.6% were Irish, and 8.0% were English.
The median income for a household in the county was $37,409 and the median income for a family was $46,470. Males had a median income of $39,301 versus $30,068 for females. The per capita income for the county was $20,199. About 15.8% of families and 21.3% of the population were below the poverty line, including 30.7% of those under age 18 and 14.9% of those age 65 or over.
Reports
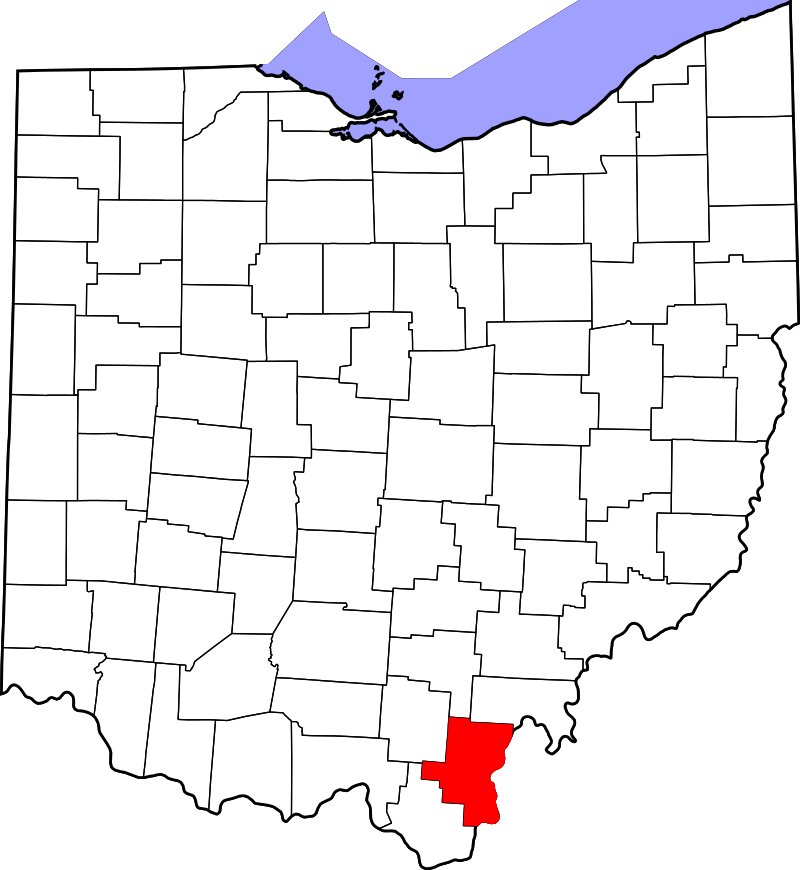
Highland County
As of the 2010 United States Census, there were 43,589 people, 16,693 households, and 11,819 families residing in the county. The population density was 78.8 inhabitants per square mile (30.4/km2). There were 19,380 housing units at an average density of 35.0 per square mile (13.5/km2). The racial makeup of the county was 96.5% white, 1.4% black or African American, 0.3% American Indian, 0.2% Asian, 0.1% from other races, and 1.5% from two or more races. Those of Hispanic or Latino origin made up 0.7% of the population. In terms of ancestry, 23.8% were German, 14.9% were Irish, 14.3% were American, and 10.7% were English.
The median income for a household in the county was $39,844 and the median income for a family was $48,604. Males had a median income of $38,892 versus $29,167 for females. The per capita income for the county was $18,966. About 12.4% of families and 16.2% of the population were below the poverty line, including 22.2% of those under age 18 and 12.7% of those age 65 or over.
Reports
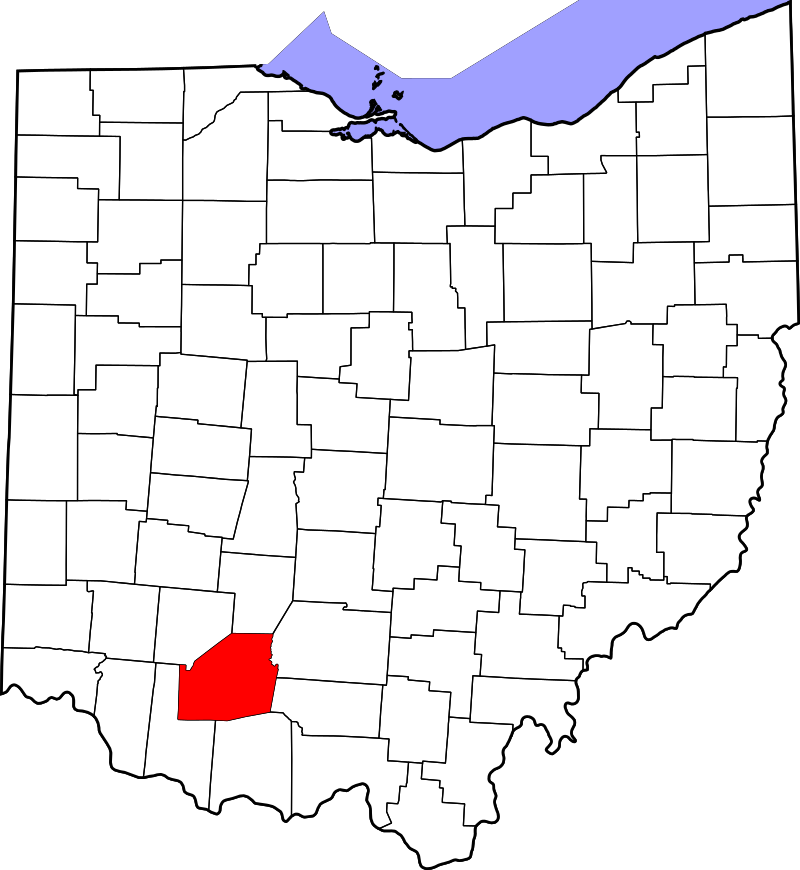
Jackson County
As of the 2010 United States Census, there were 33,225 people, 13,010 households, and 9,028 families living in the county. The population density was 79.0 inhabitants per square mile (30.5/km2). There were 14,587 housing units at an average density of 34.7 per square mile (13.4/km2). The racial makeup of the county was 97.1% white, 0.6% black or African American, 0.4% American Indian, 0.3% Asian, 0.2% from other races, and 1.4% from two or more races. Those of Hispanic or Latino origin made up 0.8% of the population. In terms of ancestry, 16.1% were German, 12.3% were American, 11.6% were Irish, 10.6% were English and 4.4% were Welsh.
The median income for a household in the county was $34,044 and the median income for a family was $42,560. Males had a median income of $36,910 versus $28,618 for females. The per capita income for the county was $18,775. About 18.1% of families and 23.3% of the population were below the poverty line, including 36.5% of those under age 18 and 11.5% of those age 65 or over.
Reports
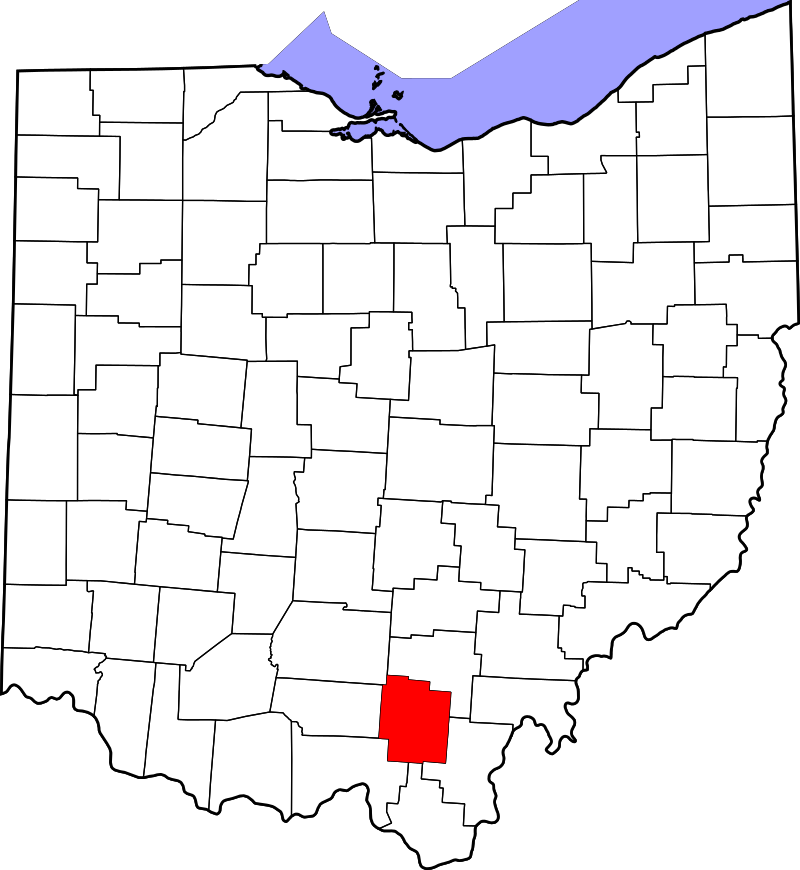
Lawrence County
As of the 2010 United States Census, there were 62,450 people, 24,974 households, and 17,405 families living in the county. The population density was 137.7 inhabitants per square mile (53.2/km2). There were 27,603 housing units at an average density of 60.9 per square mile (23.5/km2). The racial makeup of the county was 95.9% white, 2.0% black or African American, 0.4% Asian, 0.2% American Indian, 0.2% from other races, and 1.4% from two or more races. Those of Hispanic or Latino origin made up 0.7% of the population. In terms of ancestry, 18.0% were American, 15.4% were German, 12.9% were Irish, and 10.8% were English. In Lawrence County, less than 1% of people who self-identify as “Irish” are Catholic. Scholars believe this is part of a trend in which people are vaguely aware that at least some of their ancestors come from Ireland, but that population is primarily of “Scots-Irish” or “Ulster Scots” ancestry, and those identifying as “Irish” are simply unaware of the distinction. Those citing “American” ancestry in Lawrence County are of overwhelmingly English extraction, most English Americans identify simply as American because their ancestors have been in North America for centuries—in some cases since the 1600s.
The median income for a household in the county was $36,461 and the median income for a family was $46,732. Males had a median income of $38,170 versus $28,251 for females. The per capita income for the county was $19,452. About 15.2% of families and 19.4% of the population were below the poverty line, including 28.0% of those under age 18 and 11.9% of those age 65 or over.
Reports
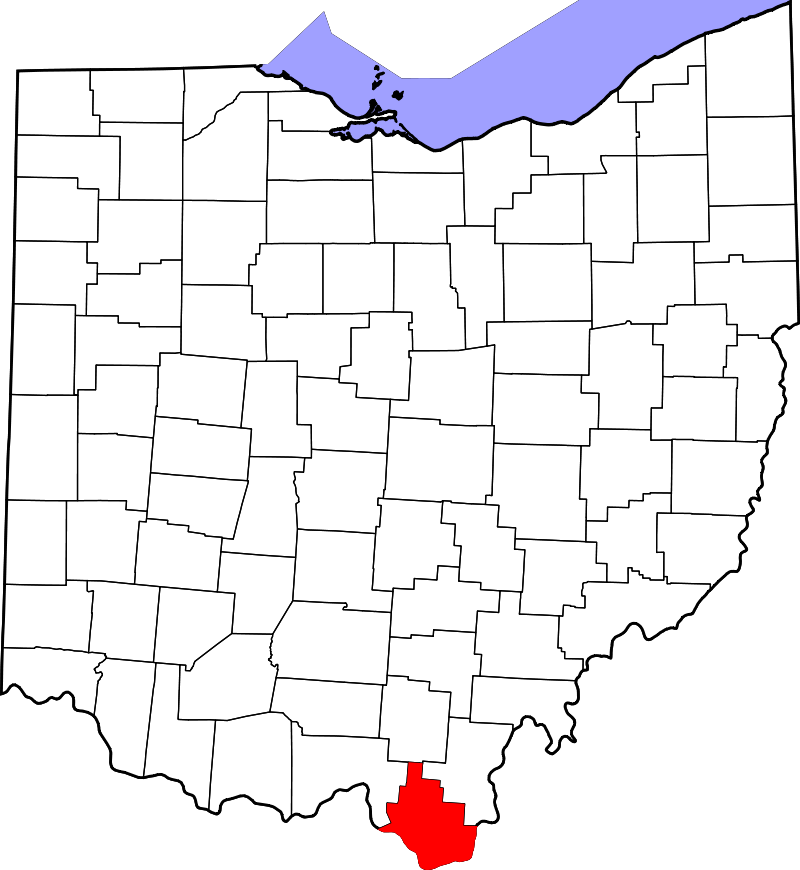
Pike County
As of the 2010 United States Census, there were 28,709 people, 11,012 households, and 7,743 families living in the county. The population density was 65.2 inhabitants per square mile (25.2/km2). There were 12,481 housing units at an average density of 28.3 per square mile (10.9/km2). The racial makeup of the county was 96.6% white, 0.9% black or African American, 0.5% American Indian, 0.2% Asian, 0.2% from other races, and 1.6% from two or more races. Those of Hispanic or Latino origin made up 0.7% of the population. In terms of ancestry, 19.3% were German, 14.8% were Irish, 12.9% were English, and 12.5% were American.
The median income for a household in the county was $35,912 and the median income for a family was $43,010. Males had a median income of $40,645 versus $27,422 for females. The per capita income for the county was $17,494. About 18.0% of families and 23.6% of the population were below the poverty line, including 32.7% of those under age 18 and 15.2% of those age 65 or over.
Reports
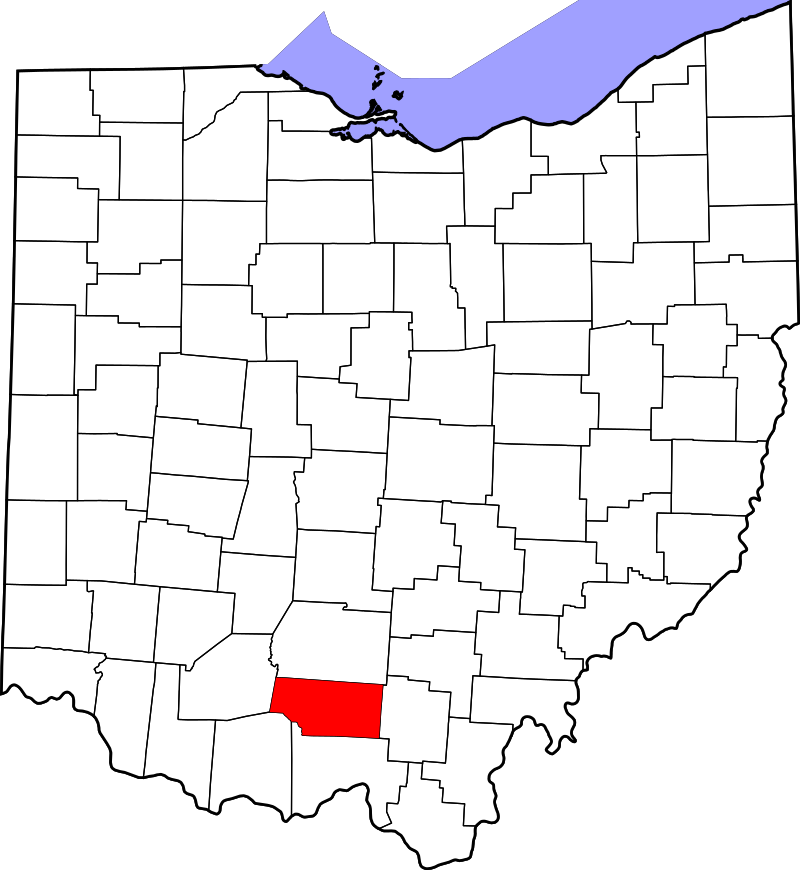
Ross County
As of the 2010 United States Census, there were 78,064 people, 28,919 households, and 19,782 families in the county. The population density was 113/sqmi (43.7/km2). There were 32,148 housing units at an average density of 46.6/sqmi (18.0/km2). The racial makeup of the county was 90.7% white, 6.2% black or African American, 0.4% Asian, 0.3% American Indian, 0.3% from other races, and 2.1% from two or more races. Those of Hispanic or Latino origin made up 1.0% of the population. In terms of ancestry, 27.0% were German, 15.2% were Irish, 12.5% were American, and 10.5% were English.
The median income for a household in the county was $42,626 and the median income for a family was $50,081. Males had a median income of $42,721 versus $32,374 for females. The per capita income for the county was $20,595. About 13.1% of families and 17.3% of the population were below the poverty line, including 24.7% of those under age 18 and 8.2% of those age 65 or over.
Reports
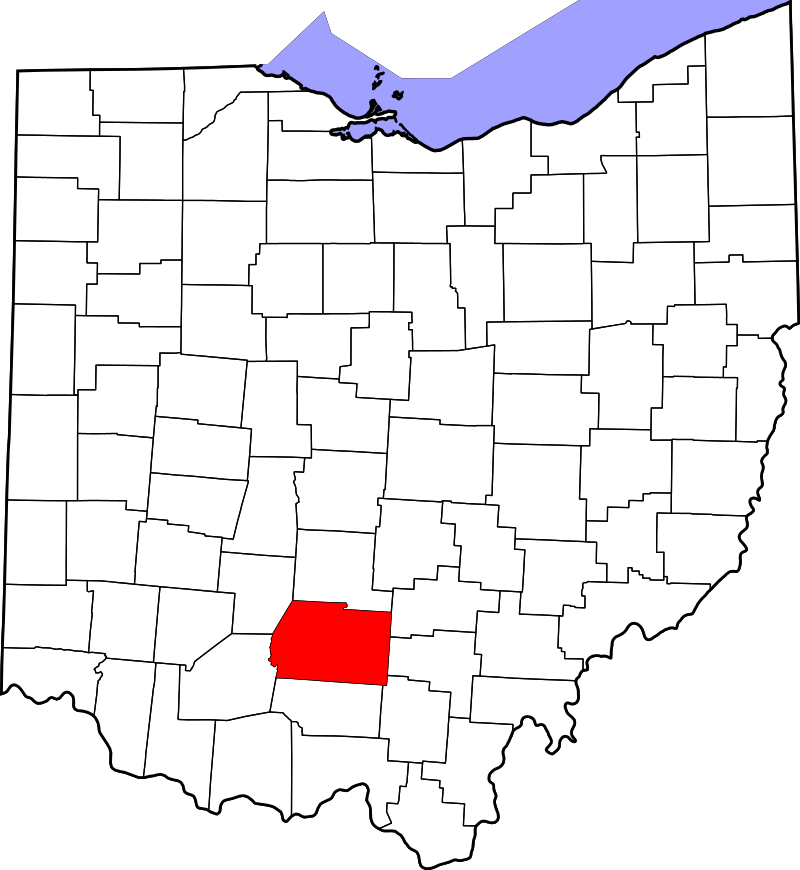
Scioto County
As of the 2010 United States Census, there were 79,499 people, 30,870 households, and 20,911 families residing in the county. The population density was 130.3 inhabitants per square mile (50.3/km2). There were 34,142 housing units at an average density of 56.0 per square mile (21.6/km2). The racial makeup of the county was 94.4% white, 2.7% black or African American, 0.5% American Indian, 0.3% Asian, 0.3% from other races, and 1.7% from two or more races. Those of Hispanic or Latino origin made up 1.1% of the population. In terms of ancestry, 22.9% were German, 15.0% were Irish, 12.1% were American, and 10.1% were English.
The median income for a household in the county was $32,812 and the median income for a family was $44,122. Males had a median income of $40,876 versus $29,675 for females. The per capita income for the county was $17,778. About 16.4% of families and 20.8% of the population were below the poverty line, including 28.4% of those under age 18 and 11.8% of those age 65 or over.
Reports
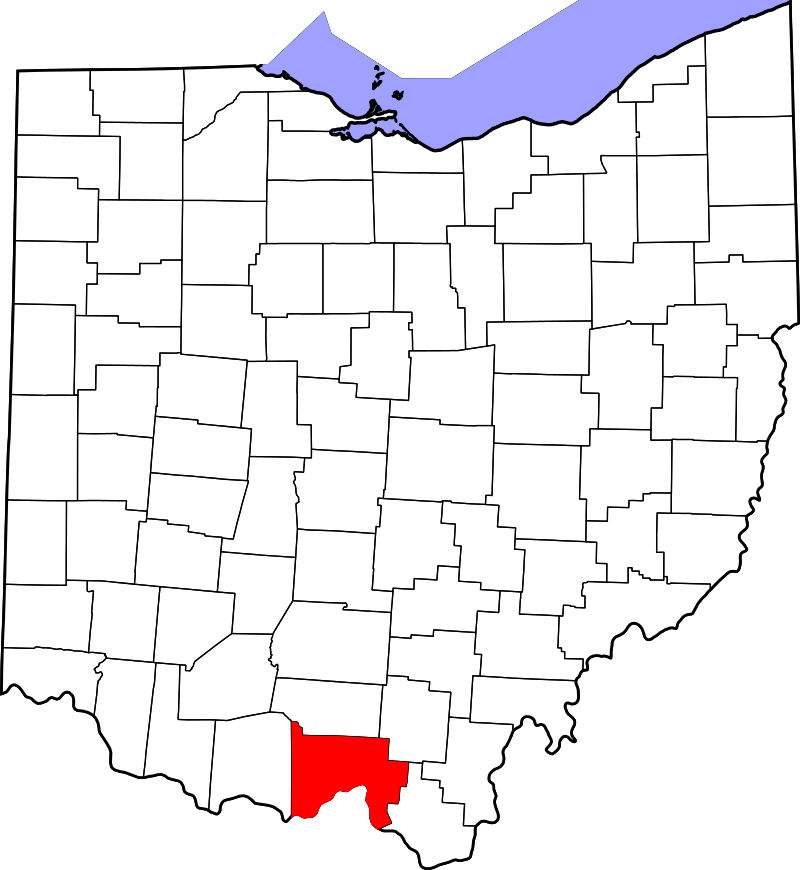
Vinton County
As of the 2010 United States Census, there were 13,435 people, 5,260 households, and 3,640 families residing in the county. The population density was 32.6 inhabitants per square mile (12.6/km2). There were 6,291 housing units at an average density of 15.3 per square mile (5.9/km2). The racial makeup of the county was 97.9% white, 0.4% American Indian, 0.3% black or African American, 0.2% Asian, 0.1% from other races, and 1.1% from two or more races. Those of Hispanic or Latino origin made up 0.5% of the population. In terms of ancestry, 17.0% were German, 16.2% were American, 14.2% were Irish, and 7.5% were English.
The median income for a household in the county was $34,242 and the median income for a family was $37,409. Males had a median income of $36,598 versus $28,226 for females. The per capita income for the county was $16,736. About 17.3% of families and 19.5% of the population were below the poverty line, including 25.8% of those under age 18 and 13.3% of those age 65 or over.
Reports
OVRDC Region
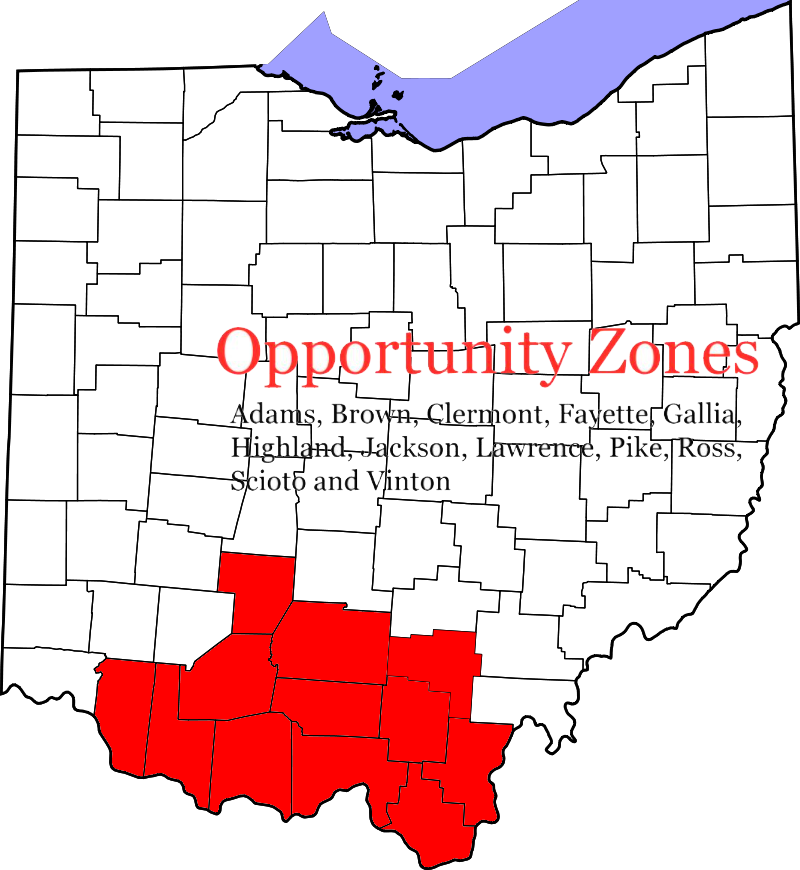
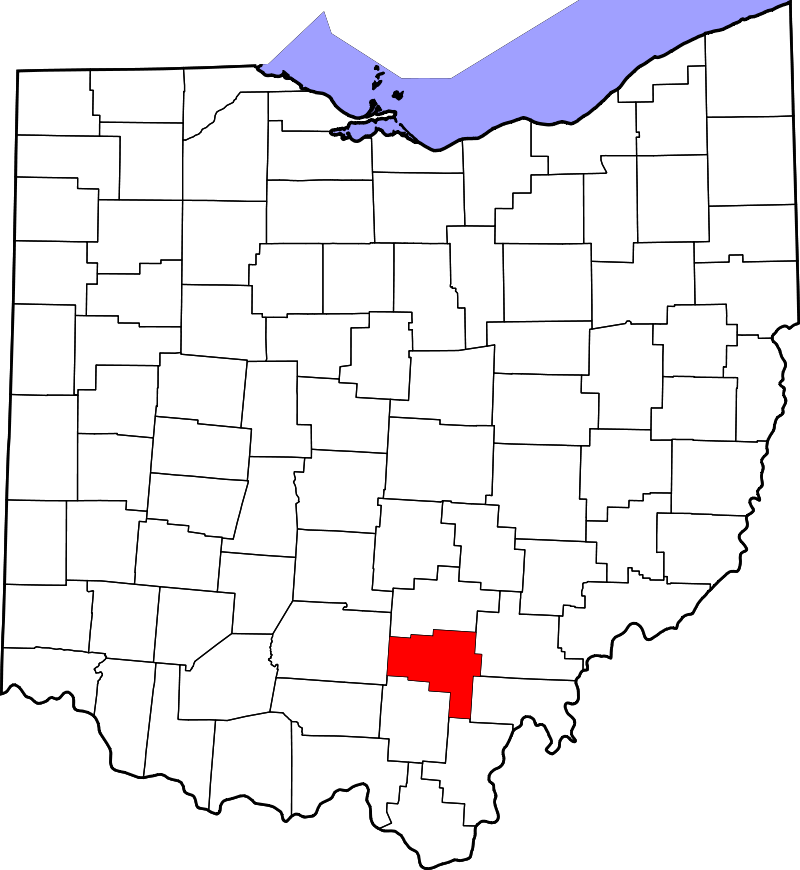
The Ohio Valley Region encompasses twelve counties in Southern Ohio. The region is populated by approximately 670,000 residents and spans 6,022 square miles. There are 171 townships, 70 villages, 9 cities, and 14 census-designated places (CDP’s).
Reports
